









Vehicle Speed Data Collection and Analysis: A Practical Guide
Vehicle speed data collection is an important part of modern traffic surveys, road planning, transportation research, and traffic management. By measuring how vehicles travel along a road, transportation professionals can better understand traffic patterns, identify changes in driving behavior, and evaluate the performance of different road environments.
However, collecting speed readings is only the first step. Reliable traffic research also requires a suitable measurement method, a representative observation period, consistent data recording, and careful statistical analysis.
Vehicle speed data may be collected using handheld laser speed meters, radar speed detectors, fixed roadside sensors, video-based systems, or other traffic monitoring technologies. Each method has different capabilities and limitations, so equipment should be selected according to the survey objectives and required data fields.
This guide explains how to plan vehicle speed data collection, choose suitable measurement equipment, analyze speed distributions, improve data quality, and present useful results for traffic studies.
1. What Is Vehicle Speed Data Collection?
Vehicle speed data collection is the process of measuring and recording the speeds of vehicles traveling through a specific location or road section.
Depending on the equipment and survey design, the collected information may include individual vehicle speeds, timestamps, vehicle classifications, travel direction, lane information, traffic volume, or other relevant observations.
The exact data available depends on the measurement technology. For example, a handheld speed measurement device may provide readings for individually targeted vehicles, while a fixed traffic sensor may record vehicle passages continuously over a longer period.
Common applications include:
Road traffic surveys and transportation research
Highway traffic flow analysis
Speed distribution studies
Before-and-after evaluations of road changes
Traffic engineering and road design
Vehicle testing and controlled speed measurements
Evaluation of traffic management strategies
Planning for intelligent transportation systems
A clear survey objective helps determine what information must be collected and which measurement method is appropriate.
2. Define the Objectives Before Collecting Data
A successful vehicle speed survey begins with a clearly defined question. Without a specific objective, it can be difficult to determine where to measure, how long to collect data, or which statistics should be reported.
For example, a transportation team may want to understand typical speeds on an urban road, compare speeds during peak and off-peak periods, or evaluate whether vehicle speeds change after a road layout modification.
Different objectives require different collection strategies.
Road speed distribution
If the objective is to understand the distribution of vehicle speeds, the survey should capture enough valid observations across the relevant traffic conditions. Reporting only a single average may conceal meaningful differences between slower and faster vehicles.
Traffic flow analysis
A traffic flow study may need speed readings together with traffic volume, vehicle classification, lane, and direction. These additional fields help explain how speed patterns relate to traffic conditions.
Before-and-after comparison
When comparing conditions before and after a road improvement, the measurement location, collection method, observation periods, and data processing rules should be as consistent as possible.
Vehicle testing
Controlled vehicle testing may require more detailed timestamps, repeated measurements, defined test conditions, and equipment with suitable accuracy and data export capabilities.
Defining the objective first makes the entire data collection process more efficient and improves the relevance of the final report.
3. Common Methods for Collecting Vehicle Speed Data
Different measurement technologies serve different survey requirements. The choice should reflect the required accuracy, observation duration, traffic environment, and type of output data.
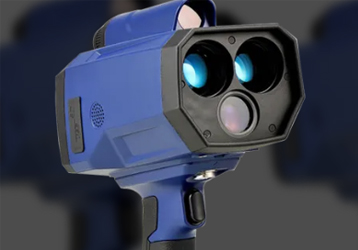
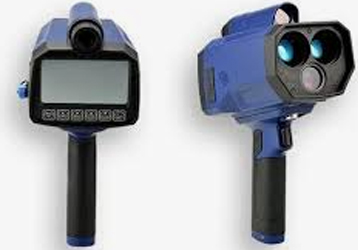
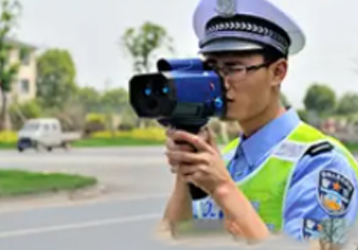
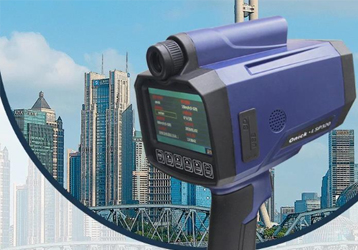
Handheld laser speed measurement devices
Laser-based devices measure distance changes over time to estimate the speed of a targeted vehicle. They can be useful for selective measurements where an operator needs to obtain individual vehicle readings.
Potential advantages include portability, flexible positioning, and the ability to target particular vehicles under suitable conditions.
However, results depend on the device specifications, operating procedure, target conditions, environmental factors, and operator technique. A handheld device does not automatically provide continuous traffic volume or a complete record of every vehicle passing the site.
Radar speed detectors
Radar equipment uses reflected radio waves to estimate the speed of moving vehicles. Depending on its design, a radar device may be handheld, vehicle-mounted, roadside-mounted, or integrated into a larger traffic monitoring system.
Radar-based equipment can be useful for field surveys and selected traffic monitoring applications. Buyers should check whether the device measures individual targets, detects multiple vehicles, stores records, or supports data export.
The capabilities of different radar systems vary considerably, so the product specifications should be reviewed before selecting equipment for a particular survey.
Fixed traffic sensors
Fixed sensors can monitor vehicle movements at a specific location over an extended period. Depending on the technology, they may collect vehicle counts, speed estimates, vehicle classifications, or occupancy-related information.
These systems can be appropriate when researchers need consistent observations across different times of day or multiple days.
Installation requirements, lane coverage, calibration or verification procedures, environmental suitability, and maintenance costs should be considered during planning.
Video-based traffic monitoring
Video systems can support traffic observation and analysis when camera placement, image quality, processing software, and environmental conditions are suitable.
Depending on the system, video analytics may estimate vehicle speeds, count traffic, classify vehicles, or track movements through a defined area.
Video-based speed estimates should be validated against an appropriate reference method when accuracy is important. Camera calibration, perspective distortion, occlusion, lighting, and image resolution may affect the results.
Video may also capture identifiable information, so data collection, access, storage, and retention must follow applicable privacy rules.
Comparing data collection methods
| Method | Typical strength | Important limitation |
|---|---|---|
| Handheld laser device | Selective, portable measurements | Requires correct targeting and operator procedure |
| Radar speed detector | Flexible measurement configurations | Performance depends on device design and traffic conditions |
| Fixed traffic sensor | Consistent observations over time | May require installation and site-specific setup |
| Video analytics | Can combine speed estimates with visual traffic observations | Results depend on calibration, image quality, and processing |
| Manual observation | Simple for limited survey tasks | Labor-intensive and vulnerable to recording errors |
No single method is ideal for every project. The best choice is the one that produces the information required by the survey under the actual site conditions.
4. How to Plan a Reliable Vehicle Speed Survey
A well-designed survey should account for location, observation period, sample size, traffic conditions, and data recording procedures.
Select a representative location
Choose a measurement location that reflects the research question. Consider road geometry, lane configuration, traffic controls, gradients, nearby intersections, roadside obstructions, and the presence of merging or turning movements.
If the purpose is to study general traffic behavior, a location affected by a nearby signal, congestion queue, or sharp bend may produce results that are not representative of the wider road section. Such locations can still be useful, but their influence should be documented.
Choose suitable observation periods
Traffic speeds can vary by time of day, day of the week, weather, road works, and traffic demand.
A short observation period may be appropriate for a limited screening exercise, but it may not represent normal conditions. Longer or repeated surveys can help capture variation across relevant periods.
Record the date, start and end times, weather conditions when relevant, and any unusual events that may affect the results.
Define the sampling approach
A survey should specify which vehicles are included, how observations are selected, and how missing or invalid readings are handled.
If operators selectively target vehicles, the selection process may introduce bias. For example, measuring only easily visible vehicles or choosing vehicles in a particular lane may produce a sample that differs from the overall traffic stream.
For automated systems, verify whether all eligible vehicle passages are recorded or whether detection limitations lead to missed observations.
Record traffic context
Speed readings become more useful when they can be interpreted in context.
Where appropriate, record:
Measurement location and direction of travel
Lane or road section
Date and observation time
Traffic volume during the observation period
Vehicle category, if supported by the method
Weather and road surface conditions
Temporary traffic controls or unusual incidents
Equipment identification and relevant setup information
These fields help other readers understand how the data was obtained and whether comparisons are reasonable.
5. Important Vehicle Speed Statistics
After data collection, statistical analysis can summarize the observations and reveal patterns that may not be obvious from individual readings.
Mean speed
The mean speed is the arithmetic average of the recorded vehicle speeds.
It is calculated by adding all valid speed observations and dividing the total by the number of observations.
Mean speed is easy to understand, but it can be influenced by unusually low or high readings. It should not be treated as a complete description of the speed distribution.
Median speed
The median is the middle value when valid observations are arranged in order. For an even number of observations, it is calculated from the two middle values.
The median is useful when a small number of extreme observations may distort the mean. Comparing the mean and median can also help identify asymmetry in a speed distribution.
85th-percentile speed
The 85th-percentile speed is the speed at or below which approximately 85% of the observations fall, according to the selected percentile calculation method.
This statistic is often used in traffic engineering and speed studies. However, its interpretation depends on the survey design, local engineering practice, and applicable guidance.
The 85th-percentile speed should not be used alone to conclude that a road is safe or unsafe. Road geometry, crash history, vulnerable road users, traffic volume, visibility, speed limits, and other contextual factors also matter.
Speed distribution
A speed distribution shows how frequently different speeds occur within a dataset.
A histogram or grouped frequency table can reveal whether most vehicles travel within a narrow range or whether the observations are spread across several speed ranges.
A distribution may also show separate patterns caused by different vehicle categories, traffic conditions, or road users. Where such differences are important, analyze the groups separately rather than combining them without explanation.
Variation and spread
Measures such as the range, interquartile range, and standard deviation describe the variability of recorded speeds.
A large spread may indicate that vehicles are traveling at substantially different speeds. Nevertheless, interpretation should consider sample size, road context, vehicle mix, and measurement quality.
6. Data Quality Control and Validation
Poor-quality observations can undermine an otherwise well-designed traffic survey. Quality control should therefore be part of the collection and analysis process.
Check the measurement equipment
Review the manufacturer's instructions, operating limits, maintenance requirements, and applicable verification procedures. Where formal calibration or traceability is required, follow the relevant standards and local requirements.
Record the equipment model, identification details, and verification status where appropriate.
Identify implausible readings
Automated data processing may flag values that fall outside the expected range for the survey. These values should be reviewed rather than automatically deleted.
An unusual reading could result from a measurement error, incorrect unit conversion, data transmission problem, or a genuine event. Establish transparent rules for flagging, investigating, excluding, or retaining such observations.
Handle missing data consistently
Missing records may occur because of sensor outages, obstructed targets, communication failures, or incomplete manual notes.
Report the amount and pattern of missing data when they could influence the conclusions. Avoid filling missing values with invented measurements or silently removing substantial portions of the dataset.
Check units and timestamps
Mixing kilometers per hour and miles per hour can create serious reporting errors. Confirm the unit of every source field before combining datasets.
Also check timestamp formats, time zones where relevant, duplicate records, location labels, and data ordering. Consistent metadata makes later comparison and review much easier.
Preserve an audit trail
Keep the original data separate from processed data. Document cleaning rules, transformations, exclusions, and calculation methods.
A transparent workflow enables another analyst to reproduce the results and identify the source of any discrepancies.
7. Comparing Speed Data Across Locations and Time Periods
Comparisons can help identify differences in traffic patterns, but they are only meaningful when the datasets are sufficiently comparable.
When comparing two road locations, consider whether they have similar road functions, speed limits, geometry, lane configurations, and traffic conditions.
When comparing different dates, check whether observation periods, weather, traffic demand, construction activity, and equipment settings differed.
For before-and-after studies, use consistent measurement procedures wherever practical. If the collection method changed, explain the difference and evaluate whether it could affect the findings.
Results should include the number of valid observations, observation period, measurement method, relevant units, and any major limitations.
A difference between two recorded averages does not automatically establish that a road intervention caused the change. Additional evidence and an appropriate evaluation design may be needed to support causal conclusions.
8. Presenting Vehicle Speed Data Clearly
A useful traffic report presents the results in a way that technical and nontechnical readers can understand.
Recommended reporting elements include:
Survey overview: Explain the objective, location, dates, equipment, and collection method.
Sample description: State the number of valid observations and identify any important sampling limitations.
Summary statistics: Present the mean, median, selected percentiles, and measures of spread when appropriate.
Visual analysis: Use histograms, frequency tables, box plots, or time-series charts that match the data and question.
Contextual information: Describe traffic conditions, road characteristics, unusual events, and relevant environmental factors.
Limitations: Explain potential sources of measurement error, missing records, sampling bias, and restrictions on interpretation.
Charts should include readable axis labels, units, time periods, and clear descriptions. If multiple locations or vehicle groups are compared, use consistent scales and explain the grouping rules.
Avoid reporting excessive decimal places that imply more precision than the measurement method supports.
9. Selecting Equipment for Vehicle Speed Data Collection
When purchasing speed measurement equipment for traffic surveys, start with the required data rather than selecting a device based only on its advertised maximum range or headline accuracy.
Ask the following questions:
Does the project require individual speed readings or continuous monitoring?
Must the system record timestamps, direction, lane, or vehicle category?
Is manual operation acceptable, or is automated collection necessary?
Does the equipment store data internally or export records to a computer?
Which file formats and communication interfaces are supported?
What accuracy and verification requirements apply to the project?
Can the equipment operate under the expected weather and lighting conditions?
What installation, training, maintenance, and support are required?
Are the device's legal approvals or certifications appropriate for the intended use?
Request documentation and representative sample outputs before purchasing. If data analysis is a major part of the project, verify that exported records can be imported into the team's existing spreadsheet, database, or statistical software.
For professional projects, equipment suitability should be evaluated against written technical requirements and a defined acceptance procedure.
10. Privacy, Compliance, and Responsible Data Use
Vehicle speed data collection should follow applicable legal, operational, and privacy requirements.
Basic speed measurements may not identify a driver, but systems that capture video, license plates, vehicle images, or location-linked records may process identifiable information. The legal requirements vary by jurisdiction and by the purpose of collection.
Before deploying a system, determine what information is necessary, who can access it, how long it should be retained, and whether notices, permissions, or other safeguards are required.
Use the least amount of identifiable information necessary for the research objective. Protect stored files, limit access to authorized personnel, and establish a clear retention and deletion policy.
If equipment is intended for enforcement or regulated use, confirm the applicable approval, certification, and evidentiary requirements. A device that can measure speed is not automatically authorized for every enforcement purpose.
11. Common Mistakes to Avoid
Several avoidable mistakes can reduce the value of vehicle speed research.
Using an unrepresentative sample: A small or selectively collected sample may not reflect ordinary traffic conditions.
Relying only on average speed: One statistic can conceal differences in speed distribution and variability.
Ignoring traffic context: Road design, congestion, weather, and vehicle categories may influence the observed results.
Combining incompatible datasets: Different units, collection methods, observation periods, and selection rules can make comparisons misleading.
Deleting outliers without review: Extreme values should be investigated according to documented rules.
Overstating conclusions: Speed observations alone cannot establish every aspect of road safety or prove that a specific intervention caused a change.
Failing to document the method: Without clear records of equipment, timing, sampling, and processing, the results are difficult to reproduce.
Avoiding these mistakes improves transparency and makes the final analysis more useful for transportation planning and engineering decisions.
Frequently Asked Questions
What is vehicle speed data collection?
Vehicle speed data collection is the process of measuring and recording vehicle speeds at a selected location or during a defined observation period. It supports traffic surveys, transportation research, road planning, and traffic monitoring.
Which equipment is used to collect vehicle speed data?
Common options include handheld laser speed meters, radar speed detectors, fixed roadside sensors, and video-based monitoring systems. The appropriate choice depends on the required data, observation duration, operating conditions, and accuracy requirements.
How many vehicle speed observations are needed?
There is no single sample size that is appropriate for every study. The required number depends on the research objective, expected variability, desired statistical precision, traffic conditions, and sampling design. Important studies should establish sample-size requirements before data collection.
What is the difference between mean speed and the 85th-percentile speed?
Mean speed is the arithmetic average of the recorded observations. The 85th-percentile speed is the value at or below which approximately 85% of observations fall. They describe different aspects of a speed distribution and should be interpreted in context.
Can a handheld laser speed meter collect continuous traffic data?
A handheld device is generally designed for operator-directed measurements, although specific capabilities vary by model. Continuous traffic data collection usually requires equipment designed for automated monitoring and appropriate data storage.
How can vehicle speed data quality be improved?
Use a clear survey plan, verify equipment setup, standardize operating procedures, record timestamps and units, check missing or duplicate records, review unusual values, and document every data-processing step.
Can vehicle speed data alone determine whether a road is safe?
No. Speed data can contribute to road safety analysis, but it should be considered alongside road geometry, traffic volume, crash history, visibility, vulnerable road users, and other relevant evidence.
Conclusion
Vehicle speed data collection and analysis provide valuable information for traffic surveys, road planning, vehicle testing, and transportation research. Reliable results depend on more than the measurement device: the survey objective, sampling strategy, observation conditions, data validation, and statistical interpretation are equally important.
By selecting appropriate equipment, recording consistent metadata, analyzing both central values and speed distributions, and clearly documenting limitations, organizations can produce more useful and reproducible traffic reports.
For equipment buyers and transportation professionals, the most effective approach is to define the required data first, evaluate measurement methods against those requirements, and validate the complete collection and reporting workflow before beginning a major survey.